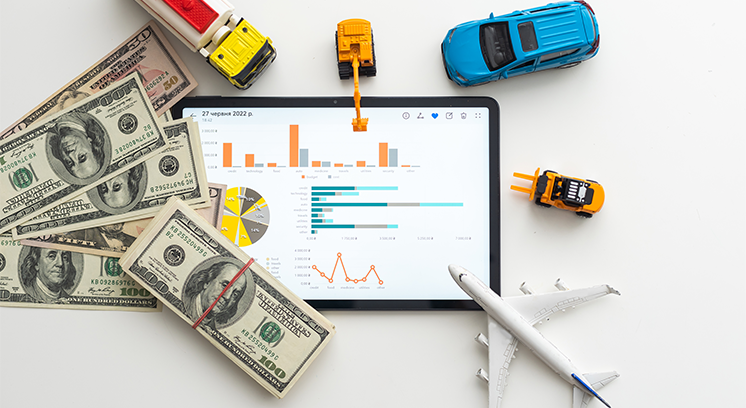


Data visualisation is a crucial aspect of transportation management. It represents data in graphical or pictorial form to help businesses understand and analyse their data effectively. With the increasing amount of data generated by transportation management systems, data visualisation has become essential in identifying trends, patterns, and opportunities to optimise supply chain management.
Data Visualisation in Transportation Management
Data visualisation is essential in transportation management, providing businesses with valuable insights into their operations. With data visualisation tools, businesses can quickly analyse and interpret data to identify patterns and trends, optimise their supply chain management processes, and make data-driven decisions that drive growth and profitability.
Data Science in Supply Chain Management
Data science in supply chain is a rapidly growing field that has revolutionised how businesses approach decision-making. In supply chain management, data science involves using statistical methods, algorithms, and machine learning techniques to analyse and make sense of complex data sets. By leveraging data science in supply chain management, businesses can gain valuable insights into their operations, identify opportunities for improvement, and make data-driven decisions that drive growth and profitability.
The Importance of Data Visualisation in Transportation Management
In transportation management, data visualisation is crucial in transforming raw data into actionable insights. With the help of data visualisation tools, businesses can quickly analyse and interpret their data, identify patterns and trends, and gain a deeper understanding of their operations. It, in turn, helps them make informed decisions that optimise their supply chain management processes.
Data visualisation is particularly important in transportation management because of the massive amounts of data generated by logistics operations. This data can come from various sources, including shipment tracking systems, warehouse management systems, and carrier performance reports. Data visualisation tools make it easier to make sense of this data and extract the insights needed to optimise transportation management.
Examples of Data Visualisation in Transportation Management
Businesses can use several data visualisation tools to analyse and interpret their transportation management data. Some of the most common ones include:
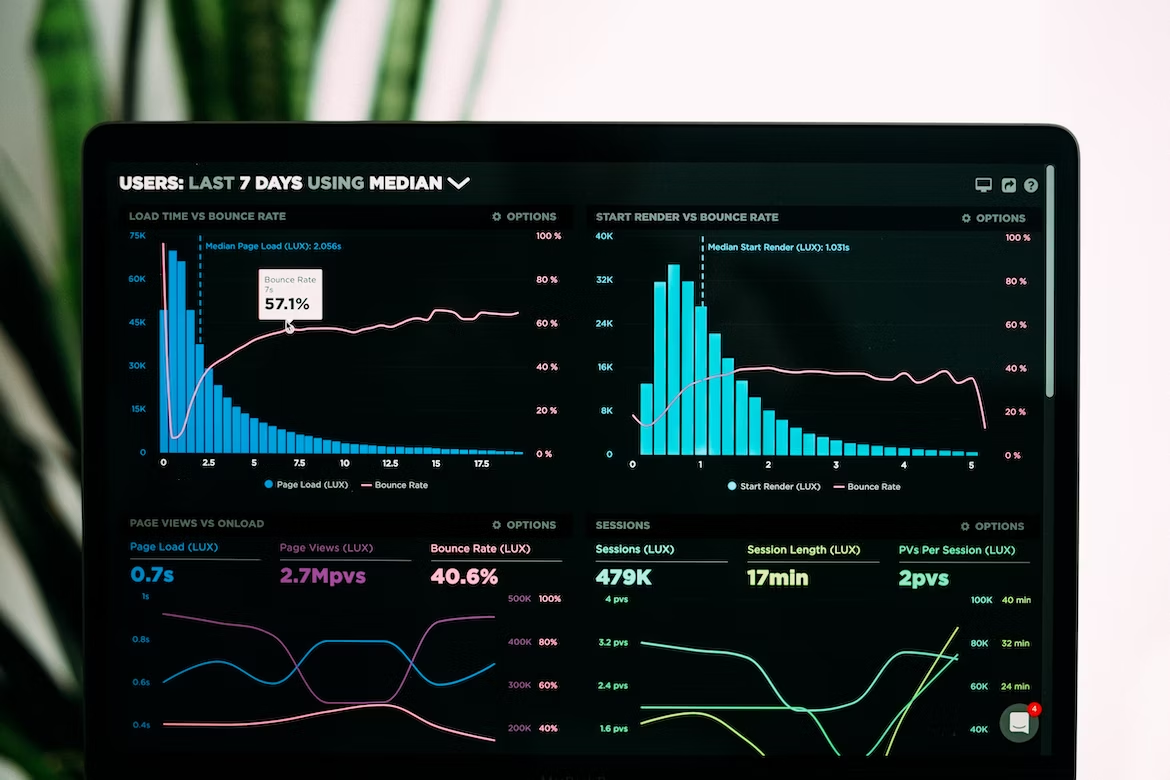
Dashboards: Dashboards are an interactive way to display data in real time. They can provide a high-level overview of transportation management metrics such as delivery times, shipping costs, and inventory levels. Dashboards can also be customised to display specific data sets or KPIs, making them useful for decision-makers.
Heat Maps: Heat maps are a visual representation of data that uses colour coding to show areas of high or low activity. Heat maps can visualise delivery routes, carrier performance, and warehouse utilisation in transportation management.
Network Maps: Network maps are a data visualisation type showing the relationship between different locations in a transportation network. They can be used to analyse transportation routes, identify bottlenecks, and optimise shipping schedules.
Benefits of Data Visualisation in Transportation Management
There are several benefits to using data visualisation tools in transportation management, including:
Improved Decision-Making: Businesses can better understand their operations and make more informed decisions using data visualisation tools. They can identify patterns and trends that would be difficult to detect using other methods and use this information to optimise their supply chain management processes.
Increased Efficiency: Data visualisation tools can help businesses streamline their transportation management operations, increasing efficiency and cost savings. Businesses can reduce transit times and improve customer satisfaction by identifying bottlenecks and optimising shipping schedules.
Enhanced Collaboration: Data visualisation tools can help businesses collaborate more effectively with their partners, such as carriers and suppliers. By sharing data in a visual format, businesses can communicate more clearly and make decisions more efficiently.
Cozentus - Your Data Science Partner for Transportation Management
Cozentus is a leading provider of data science in supply chain management solutions for transportation management. With years of experience in the industry, Cozentus has the expertise and knowledge to help businesses leverage data science to optimise their transportation management processes.
Whether you need help with data visualisation, predictive analytics, or machine learning, Cozentus has the expertise to deliver results. Get in touch with us to learn how we can help you optimise your transportation management operations with data science in supply chain.
Bottom Line
Data visualisation is a critical component of transportation management, providing businesses with valuable insights into their operations and helping them make informed decisions. By leveraging data science in supply chain management and visualisation tools, businesses can optimise their supply chain management processes, increase efficiency, and reduce costs. Cozentus is a trusted partner in the data science in supply chain industry, providing businesses with the expertise and solutions they need to succeed in transportation management. Contact us today to learn how we can help you unlock the full potential of your transportation management data.